Visualizing the Invisible: Why Maps Beat Gantt Charts
- Valeria Valenzuela
- Nov 26, 2025
- 1 min read

A 5,000-line schedule can hide everything—especially the problems. You can’t see crew congestion in a PDF.
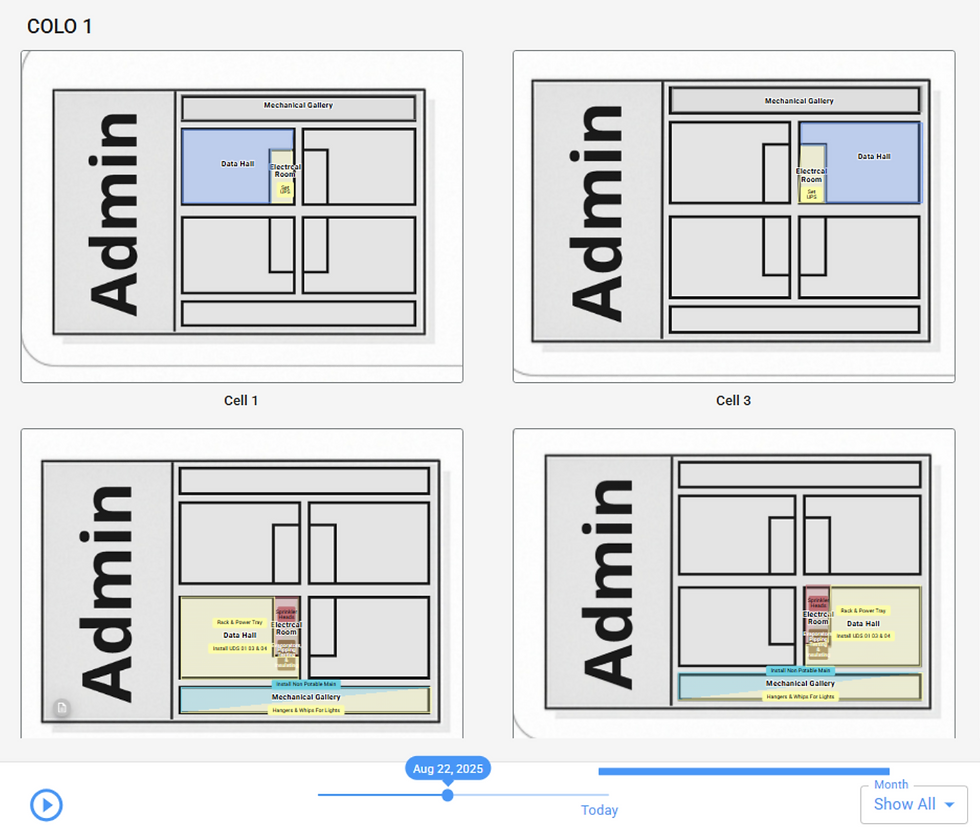
With inTakt, you can.
Zone Maps animate work across the building so you see the flow of trades, identify stacking, and find bottlenecks before they hit the field. For hyperscale footprints, spatial awareness is just as critical as time awareness.
Don’t just read the schedule—see it.


Comments